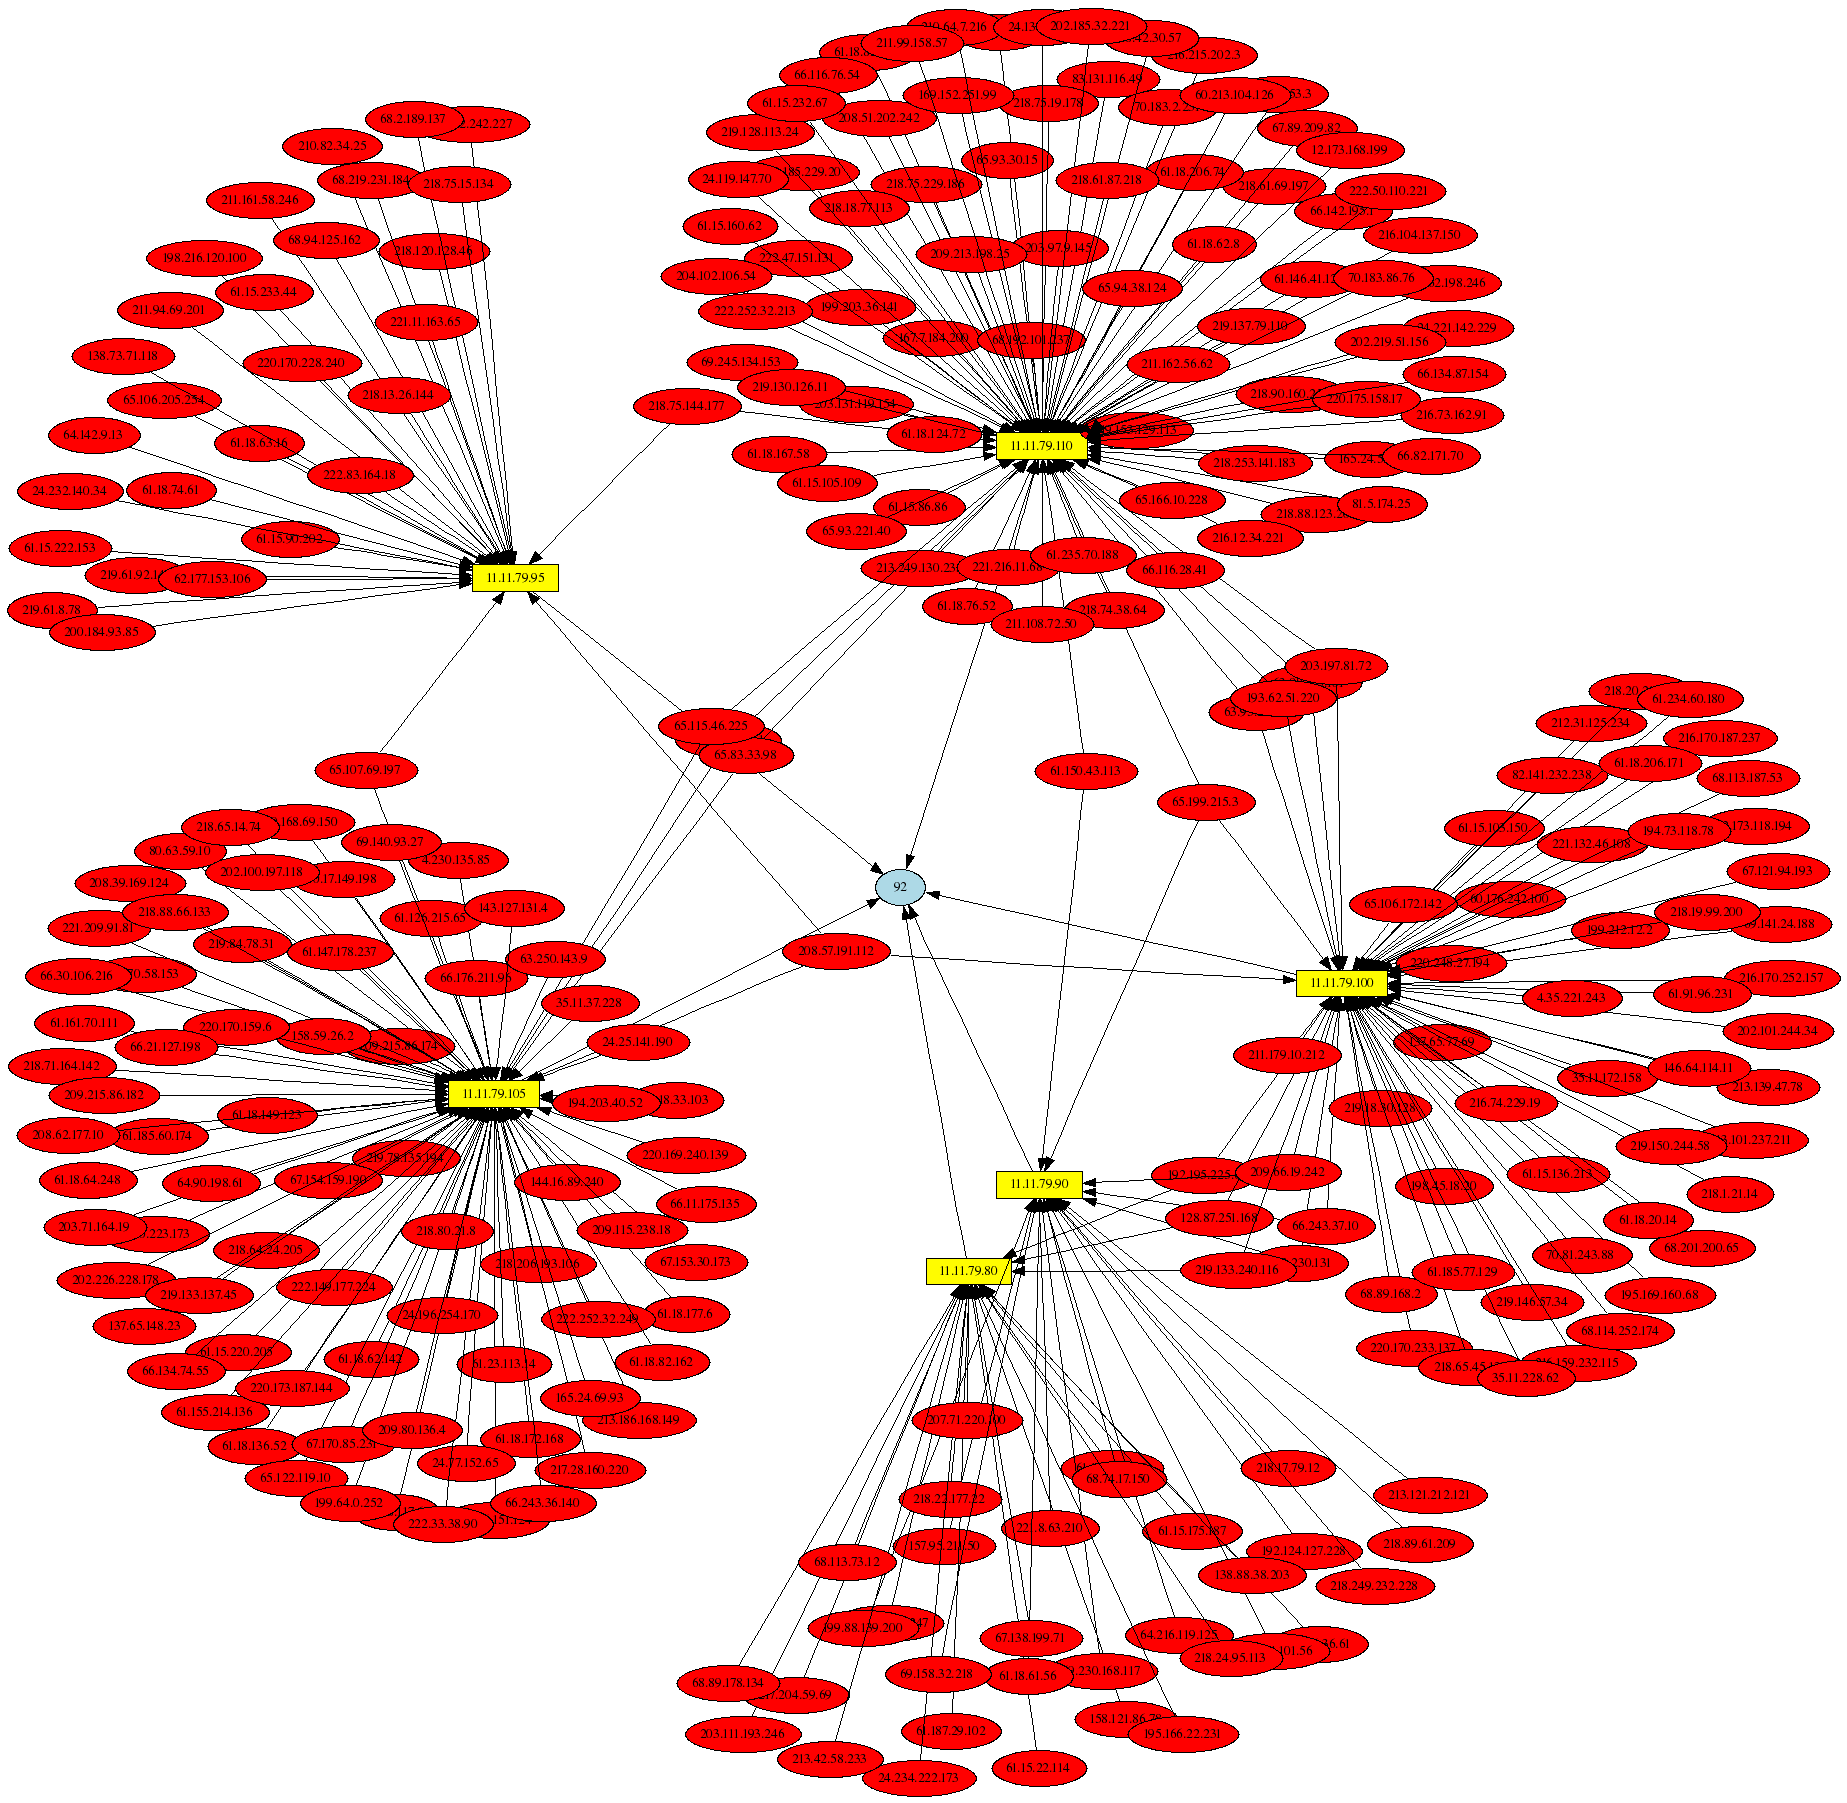
Visualizing Honeynet Project iptables Log Data
16 January, 2007
 Security visualization is becoming increasingly important as mountains of security data generated
by security software and devices continues to grow. Raffael Marty has launched the security visualization portal secviz.org where people can upload graphs of security data and discuss what they mean.
A key piece of software that can be used to generate link graphs of security data is the
AfterGlow project, which accepts CSV-formatted
input. With the 2.0 release of psad,
I have added several --CSV command line arguments so that psad can generate output that is
compatible with AfterGlow. By combining this capability with psad's forensics mode, it is possible
to generate some interesting graphs of
iptables log data
provided by the Honeynet Project. This data is part of
the Scan 34 challenge made to the security
community in which live data from a Honeynet is analyzed for evidence of malicious activity and
compromises. By
visualizing some of this data with psad and AfterGlow,
it is easy to see outbound SSH and IRC connections originating from one of the Honeynet systems
(indicating a successful compromise), and the graph of the Nachi worm is eye catching. If you run
iptables on a Linux system, you too can use psad and AfterGlow to create graphs of
your iptables log files. You might turn up some interesting relationships w.r.t. how your systems
communicate on the network, and how they are attacked.


