Bing Indexing of gitweb.cgi Links
21 January, 2012
 In June, 2011, all of the cipherdyne.org software projects were switched over to git from svn,
and at the same time the web interface was switched to gitweb (along with hosting at github)
from trac. Given the switch, I knew there would be a change to how search engines indexed the
code/data, and one question would be whether any particular search engine would take a specific
interest in the code provided via git and/or gitweb. Note that each of the fwknop, psad,
fwsnort, and gpgdir projects have raw git repositories that can be cloned directly over HTTP
from cipherdyne.org (a nice feature of git), or viewed with any browser through
gitweb.
(Personally, I like the "links2"
text-based browser rendering of gitweb pages - nice and clean.)
First, here are some stats for indexing bots from major search engines across all cipherdyne.org Apache log data for hits against gitweb.cgi from June, 2011 to today:
| Hits | Percentage | User-Agent |
| 505055 | 81.01% | Mozilla/5.0 (compatible; bingbot/2.0;) |
| 50242 | 8.06% | msnbot/2.0b (+http://search.msn.com/msnbot.htm)._ |
| 25707 | 4.12% | Mozilla/5.0 (compatible; Ezooms/1.0; ezooms.bot@gmail.com) |
| 6583 | 1.06% | Feedfetcher-Google; (+http://www.google.com/feedfetcher.html;) |
| 4310 | 0.69% | Mozilla/5.0 (compatible; Googlebot/2.1; +http://www.google.com/bot.html) |
| 1956 | 0.31% | Mozilla/5.0 (compatible; SISTRIX Crawler; http://crawler.sistrix.net/) |
| 1905 | 0.31% | Mozilla/5.0 (compatible; Purebot/1.1; +http://www.puritysearch.net/) |
| 1751 | 0.28% | Mozilla/5.0 (compatible; Yahoo! Slurp;) |
| 1625 | 0.26% | Mozilla/5.0 (compatible; MJ12bot/v1.4.0;) |
| 1451 | 0.23% | TwengaBot-Discover (http://www.twenga.fr/bot-discover.html) |
Wow! So bots associated with Microsoft's Bing search engine take the top two spots for a combined hit total of well over 500,000 since June, 2011. If spread out over the entire time period (which it's not as we'll see) that would be an average of about 2,600 hits per day, and this figure is more than 20 times the third place bot. Google is in a distant forth place, even though Google used to heavily index Trac repositories.
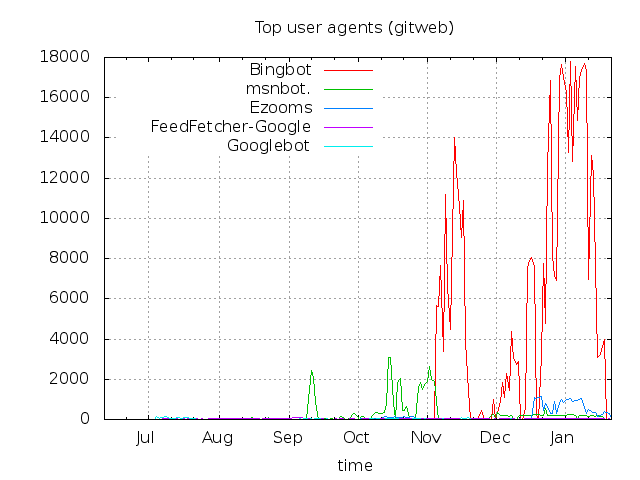
So, let's see how the search engine hits are distributed since June, 2011. First, here is a graph of just gitweb hits by the top five crawlers:
 Clearly, that is not a very uniform distribution from day to day. It looks like Bing has been
hitting the gitweb interface at a rate of over 17,000 hits per day for a significant portion
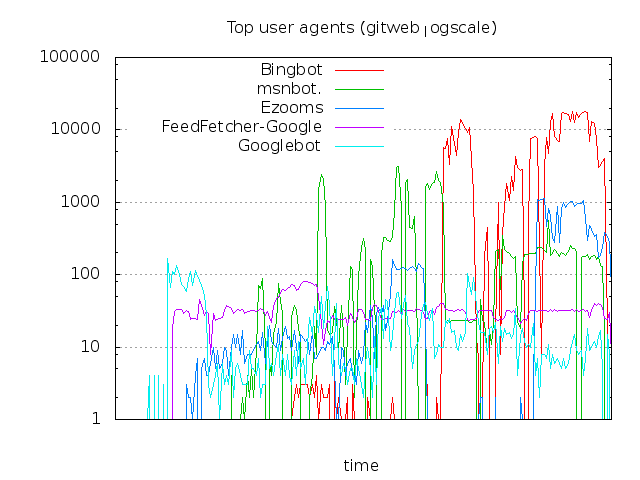
of late December and early January. The other search engines hardly even show up in the graph -
you know there are big spikes when everything looks better on a logarithmic scale:
 With some additional work, it looks like the gitweb.cgi links that Bing is indexing are not all
unique. That is, one might expect that Bing would hit a link, grab the content, and then not return
to the same link for a while. Some gitweb.cgi links were hit more than 10 times and more than 100,000
links were hit more than once during this time period.
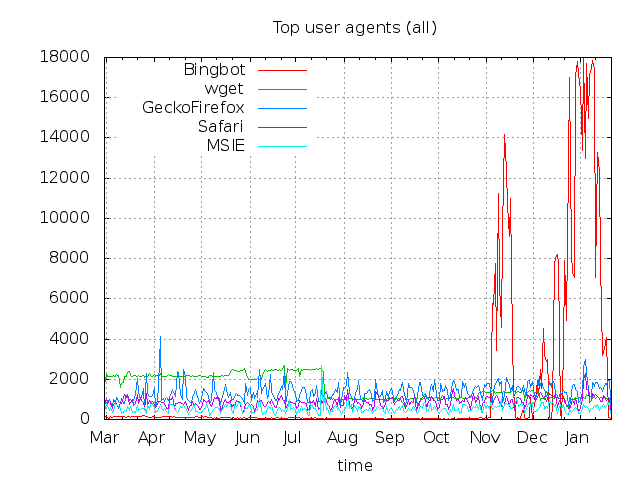
How does this compare with hits across other portions of cipherdyne.org? Bing indexing is still far and away the largest outlier:
 Given that 1) all of the information gitweb displays is derived from the underlying git repositories,
and 2) the git repositories are directly accessible via HTTP anyway, it would seem that a better way for
search engines to behave would be to just ignore gitweb altogether and pull directly from git. That
would certainly cut down on the server-side resources necessary to service search engine requests.
Perhaps though the general strategy of search engines is not to be too smart about such things - they
probably just want access to data, and when they see a link they go after it.
Either way, the kind of dedicated and repetitive indexing the Bing is doing against gitweb is a bit much,
and it certainly seems as though they could implement a less intensive crawler. I'm curious if other
server admins are seeing similar behavior.
Update 01/23: There are tons of web analysis tools out there, but I wrote a couple of quick scripts to generate the data in this blog post. The first "user_agent_stats.pl" parses Apache logs and produces user-agent graphs with Gnuplot as shown in this post. The second "uniq_hits.pl" is extremely simple and just counts the number of hits against the same links within the Apache log data. Both scripts accept log data via TDIN - here is an example where user agents who hit any "index.html" link are plotted (graph is not shown):
$ zcat ../logs/cipherdyne.org*.gz |grep "index.html" | ./user_agent_stats.pl -p index_hits

[+] Parsing Apache log data...

[+] Total agents: 1769 (abbreviated to: 174 agents)

[+] Executing gnuplot...

    Plot file:  index_hits.gif

    Agent stats: index_hits.agents


